


Polar coordinates represent a method of describing the location of points in a coordinate plane, offering an alternative to the more common Cartesian or rectangular coordinates. This system is particularly useful in fields like physics, engineering, and mathematics, where circular or spiral patterns are involved. Understanding how to plot polar coordinates involves comprehending the basic elements of this system: the radius and the angle.
Understanding the Polar Coordinate System
The polar coordinate system is defined by two components: a radius and an angle. The radius represents the distance from a central point, known as the pole, to the point of interest. The angle, typically measured in degrees or radians, indicates the direction from the pole. This system is especially beneficial when dealing with circular or rotational movements, where the radius and angle change in a way that’s more intuitively understood than with rectangular coordinates.
Plotting Points in Polar Coordinates
To plot polar coordinates, you’ll need a polar coordinate plane. This plane is marked with concentric circles that represent different radii from the pole, and lines emanating from the pole at various angles. To plot a point, you first locate the angle on the polar plane and then move outward to the correct radius. Here are the breakdown of the steps you need to take to do everything right:
- Identify the angle of the point.
- Locate this angle on the polar plane.
- Determine the radius (the distance from the pole).
- Move outward from the pole to this radius along the identified angle.
- Mark the point.
Converting Between Polar and Rectangular Coordinates
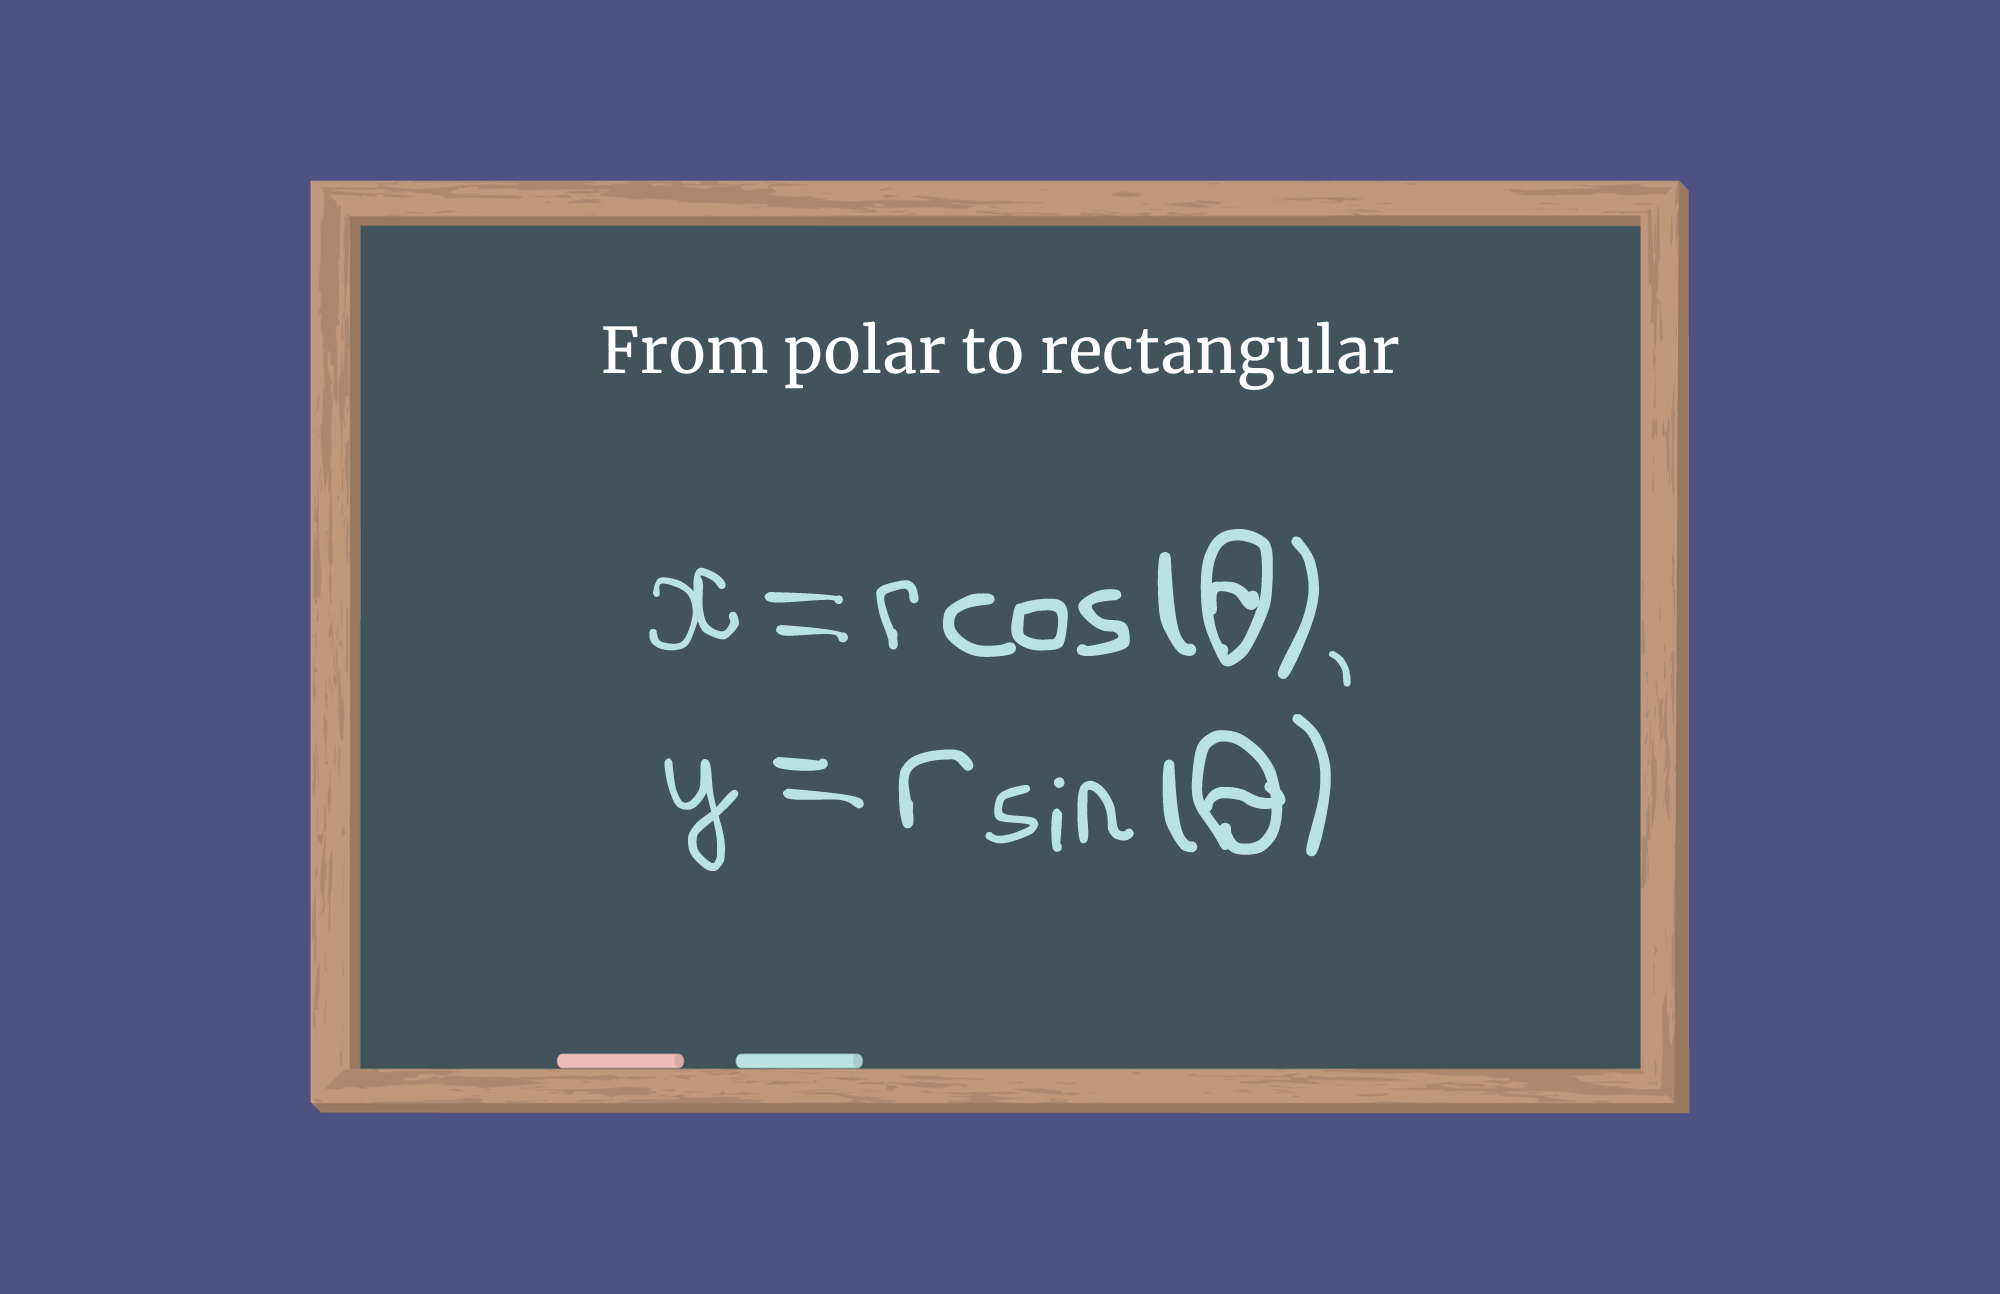
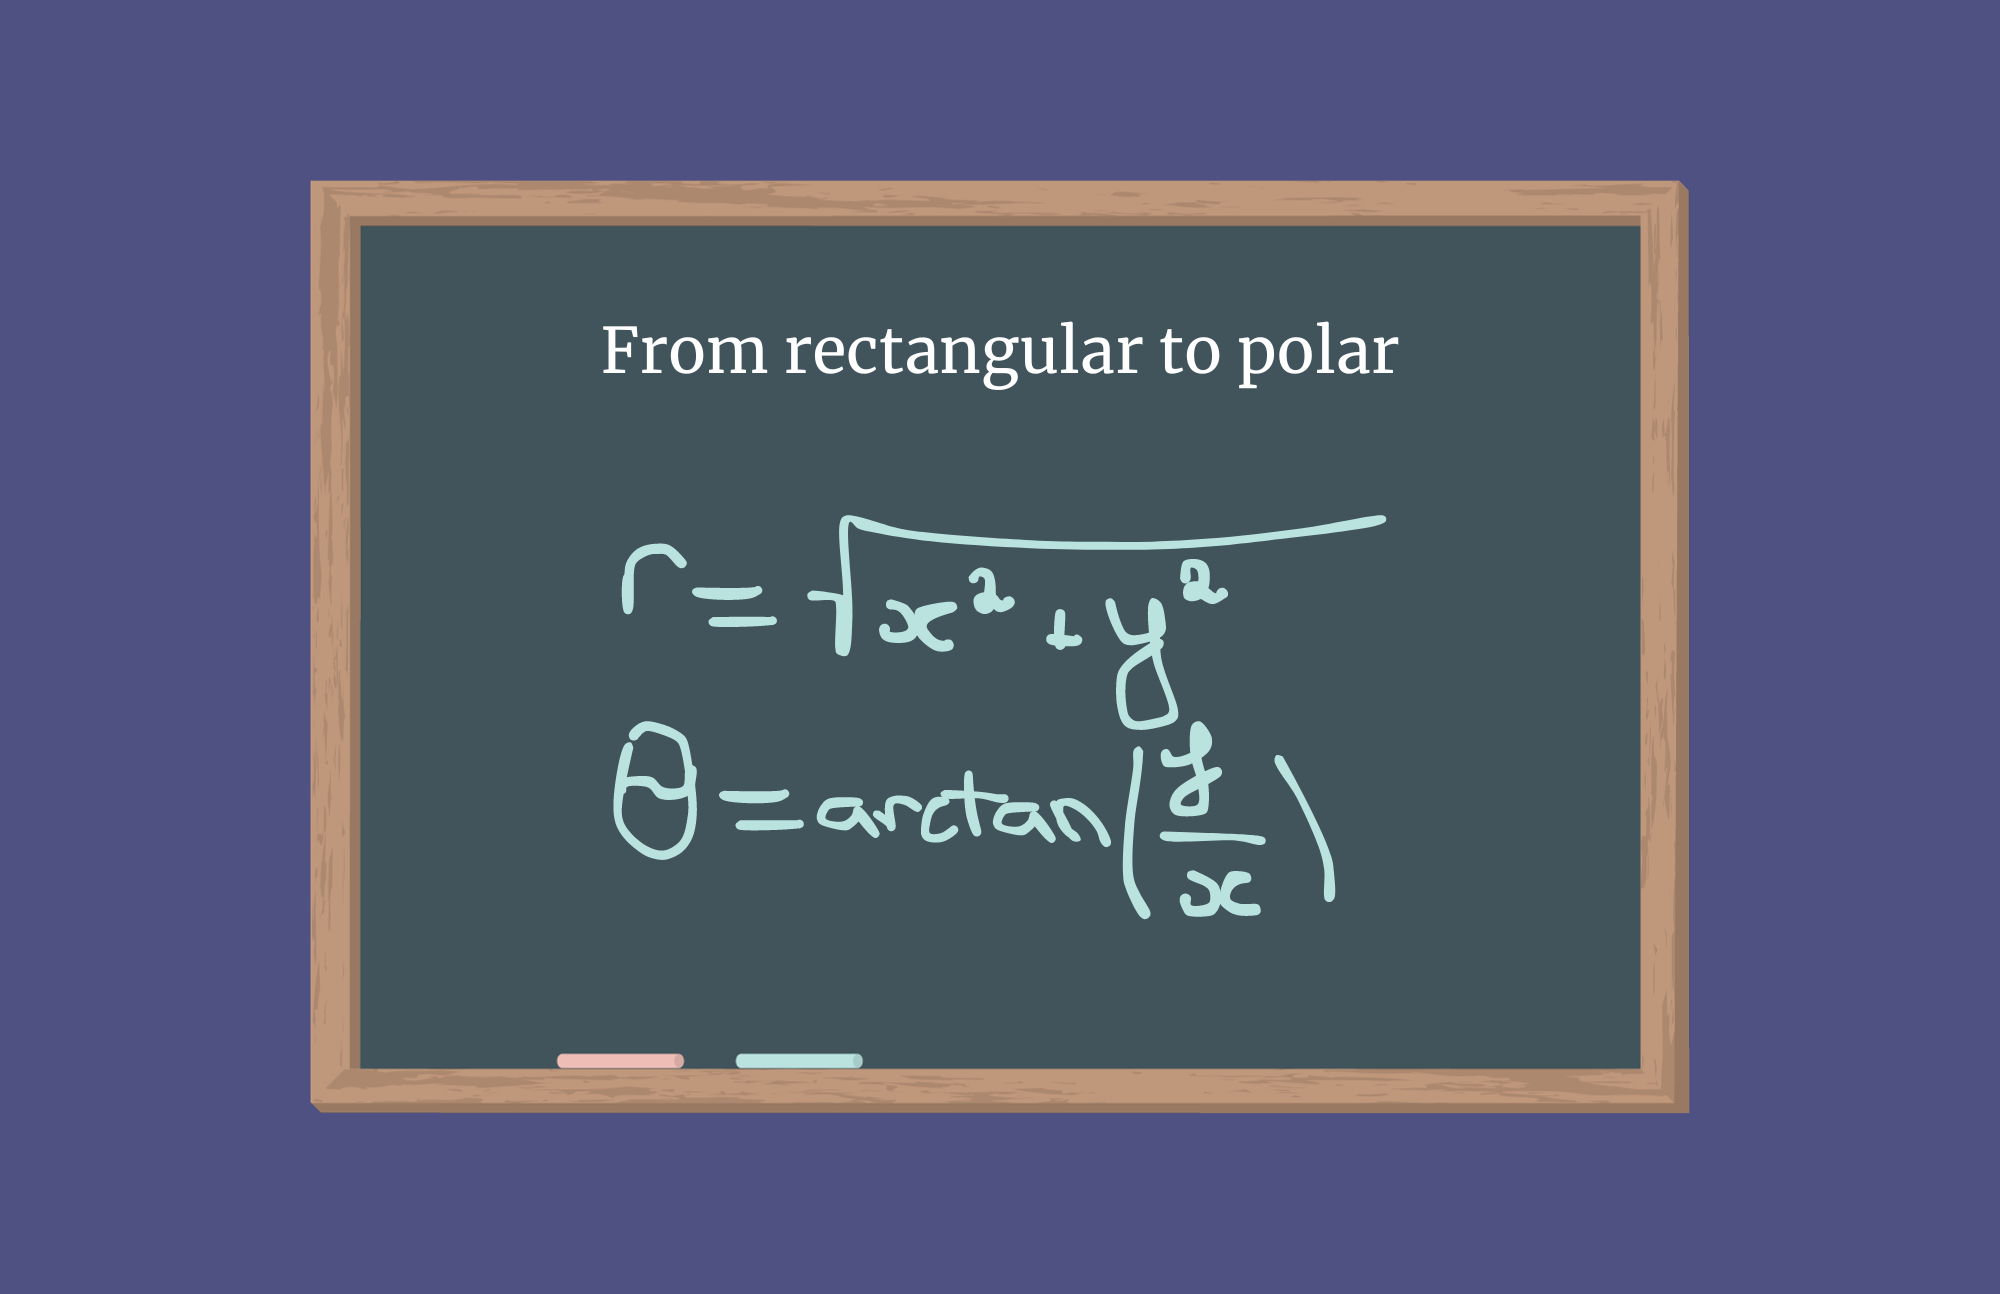
Often, you may need to convert between polar and rectangular coordinates. This is particularly useful when integrating polar coordinates with systems or equations that are in Cartesian format. The conversion is a straightforward process involving trigonometric functions.
By using the following formulas, you can seamlessly switch between the two coordinate systems as required.
Graphing Polar Coordinates
Graphing polar coordinates involves a series of points plotted on the polar coordinate plane. The process becomes particularly interesting when dealing with equations that describe curves, spirals, or circles. Graphing these coordinates provides a visual representation of these shapes and patterns.
Here are some tips for effective graphing:
- Plot several points of the equation on the polar plane.
- Connect these points to visualize the shape.
- Pay attention to positive and negative angles and their impact on the graph.
- Use a consistent scale for the radii to maintain accuracy.
Note that polar coordinates are not just theoretical constructs but have practical applications in various fields. In engineering, they are used to design components with circular or rotational symmetry. In navigation and astronomy, polar coordinates simplify the calculation of positions on spherical surfaces like Earth and celestial bodies.
Advantages of Polar Coordinates Over Rectangular Coordinates
While rectangular coordinates are more commonly used, polar coordinates offer distinct advantages in certain scenarios:
- Better suited for problems involving circles, spirals, and rotations.
- Simplify complex trigonometric problems.
- Provide a more intuitive understanding of rotational dynamics.
Despite their advantages, working with polar coordinates can present challenges, particularly for those more accustomed to Cartesian systems. The concept of angles and radial distances can be less intuitive, and special attention must be paid to the orientation and magnitude of angles, whether they are positive or negative.
Conclusion
Plotting polar coordinates is a skill that broadens your mathematical and engineering toolkit, allowing you to approach problems and scenarios that are best tackled in a non-Cartesian framework. Whether it’s for academic purposes, professional projects, or just personal interest, understanding how to plot and utilize polar coordinates is an invaluable asset in the world of science and engineering.
FAQ
More from Matlab Guides


Comments (0)
Welcome to A*Help comments!
We’re all about debate and discussion at A*Help.
We value the diverse opinions of users, so you may find points of view that you don’t agree with. And that’s cool. However, there are certain things we’re not OK with: attempts to manipulate our data in any way, for example, or the posting of discriminative, offensive, hateful, or disparaging material.