


In the realm of mathematics, certain terms hold significant importance in quantifying and analyzing data. One such term is “sigma,” denoted by the lowercase Greek letter σ. Sigma represents the standard deviation, a measure of variability in a given set of data. Understanding sigma and its implications is crucial for statistical analysis and decision-making. This article aims to provide a comprehensive guide to sigma, exploring its significance, calculation, and applications in various mathematical contexts, since online statistics homework help isn’t always available.

✅ AI Essay Writer ✅ AI Detector ✅ Plagchecker ✅ Paraphraser
✅ Summarizer ✅ Citation Generator
Unveiling the Significance of Sigma
In any scientific or medical study, the reliability of findings is of paramount importance. Sigma, or the standard deviation, plays a key role in determining the statistical significance of results. By measuring the variability within a dataset, sigma provides valuable insights into the distribution of data points. A normal distribution, often represented by a bell curve, is a common model used in many experiments. Sigma helps identify the range within which most data points are expected to fall, thereby establishing a benchmark for significance.
Calculation and Interpretation of Sigma
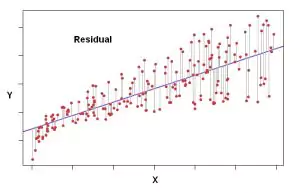
To comprehend sigma, one must first understand how it is calculated. The standard deviation is the square root of the average of squared deviations from the mean. By quantifying how far each data point deviates from the mean, sigma provides a measure of spread or variability. A smaller sigma indicates that data points are closely clustered around the mean, while a larger sigma suggests a wider spread.
When plotted on a normal distribution curve, sigma determines the percentage of data points within specific intervals. For example, one sigma above or below the mean encompasses approximately 68 percent of data points, while two sigmas account for around 95 percent. Extending to three sigmas, the range covers an impressive 99.7 percent of data points. This understanding enables researchers to evaluate the significance of individual data points based on their distance from the mean.
Sigma in Statistical Significance
In statistical analysis, sigma serves as a yardstick to assess the significance of data points or research results. A data point that deviates significantly from the model being tested indicates a potential inconsistency. Researchers often use the concept of confidence levels, which relate to the number of sigmas considered acceptable for a given situation. For instance, in election polls, a two-sigma interval (corresponding to a 95 percent confidence level) is commonly accepted as a reasonable margin of sampling error.
However, interpreting statistical significance is not a rigid science. It requires a nuanced understanding of the context and domain-specific considerations. John Tsitsiklis, an expert in electrical engineering at MIT, highlights that statistics is both an art and a science, offering room for creativity and potential mistakes. Determining appropriate measures and thresholds for statistical significance relies on careful consideration of the research field, potential sources of error, and the impact of the findings.
Sigma in the Realm of Physics
In the field of physics, sigma assumes even greater significance. Experimental results that challenge well-established scientific principles demand a higher level of confidence. The detection of neutrinos possibly exceeding the speed of light at the CERN laboratory exemplifies this scenario. Although the experiment yielded a result with a six-sigma confidence level, corresponding to an extremely low chance of a random fluke, physicists remained cautious. The unexpected nature of the finding raised suspicions about potential undetected errors, compelling further investigation.
Conversely, the interpretation of results can vary depending on their alignment with existing scientific knowledge. The announcement of a potential detection of the Higgs boson particle at CERN, albeit with a confidence level of only 2.3 sigma, garnered considerable attention. Despite the lower statistical confidence, physicists considered the finding likely to be correct due to its alignment with current physics theories.
Sigma and the Challenges of Social and Medical Sciences
Applying statistical concepts like sigma in social and medical sciences presents unique challenges. Large datasets and multiple analyses can inadvertently lead to false conclusions that pass traditional significance criteria. Random variations, or noise, within the system can generate apparent correlations that are not statistically meaningful. A 2005 paper titled “Why most published research findings are wrong” highlights the potential pitfalls and biases inherent in statistical analyses in these fields.
John Tsitsiklis underscores the complexity of statistical analysis in social and medical sciences, emphasizing the need for careful interpretation. While low statistical significance may not guarantee definitive findings, it can still serve as a valuable indicator for further investigation. Researchers must exercise caution and consider multiple factors when drawing conclusions to avoid overinterpreting or publishing fluke results.
An Essential Concept in Statistics
Sigma, the standard deviation, is an essential concept in statistical analysis that provides insights into the variability and significance of data points. From determining statistical significance to evaluating experimental results, sigma serves as a crucial tool in decision-making. However, understanding and applying sigma requires a nuanced approach, considering the specific context, domain knowledge, and potential sources of error.
Aspiring mathematicians, scientists, and researchers can leverage the knowledge of sigma to enhance their statistical analysis skills and make informed conclusions. By embracing the intricacies of sigma, we unlock the potential for deeper insights and a more robust understanding of the complex world of data analysis.
FAQ
Is there a difference between sigma and standard deviation?
No, there is no difference between sigma and standard deviation. Sigma is the Greek letter (σ) commonly used to represent the standard deviation in statistics. Both terms refer to the measure of variability or spread in a dataset.
How is sigma used to measure variability in data?
Sigma, or the standard deviation, quantifies the dispersion of data points around the mean. It provides a numerical measure of how far individual data points deviate from the average. A larger sigma indicates a greater variability or spread, while a smaller sigma suggests data points are closely clustered around the mean.
What are the properties and characteristics of a bell curve (normal distribution)?
A bell curve, or normal distribution, exhibits several key properties:
- It is symmetric and bell-shaped, with the mean at the center.
- The curve tapers off gradually on both sides, approaching but never touching the x-axis.
- The majority of data points lie close to the mean, with fewer data points at the tails.
- The mean, median, and mode of a normal distribution are equal and located at the center of the curve.
Why is sigma important in hypothesis testing and statistical significance?
Sigma plays a vital role in determining the statistical significance of results in hypothesis testing. It provides a measure of the spread of data points and enables researchers to assess the likelihood of obtaining certain outcomes by chance. By comparing data points to a predetermined threshold based on sigma values, researchers can determine if the observed results are statistically significant or if they are likely due to random variation.
How can sigma values help determine confidence intervals in statistical studies?
Sigma values are instrumental in establishing confidence intervals, which indicate the range within which true population parameters are likely to fall. For example, a two-sigma interval (corresponding to a 95 percent confidence level) suggests that if the same study were repeated multiple times, 95 percent of the resulting confidence intervals would contain the true population parameter. Sigma values provide a means to quantify the uncertainty and precision of estimates within statistical studies.
More from Statistics Guides


Comments (0)
Welcome to A*Help comments!
We’re all about debate and discussion at A*Help.
We value the diverse opinions of users, so you may find points of view that you don’t agree with. And that’s cool. However, there are certain things we’re not OK with: attempts to manipulate our data in any way, for example, or the posting of discriminative, offensive, hateful, or disparaging material.